P.I. - Solve it like Magnum
Investigating data center cooling performance with the Performance Indicator (PI).
Data center management needs to cope with ever-changing business requirements, the introduction of novel technologies, and the pressure that follows in the wake of increasingly scrutinizing news coverage. Throw into the equation an industry-wide drive towards greener and more cost-effective operation, and we see it’s not simply a case of performing well, but performing well in the face of continuous adaptation.
But how is performance defined? PUE has been our classic go-to metric for measuring energy efficiency, and understanding where ‘performance’ improvements can be made.
Now I know what you’re thinking – and you’re right – there is more to performance than just efficiency! Maximizing performance requires everything from an efficient external plant to a well-planned whitespace layout that can safely accommodate all the equipment the business needs to meet its full operational capacity.
With a focus on the cooling behavior of the data center, The Green Grid’s Performance Indicator (PI) approach gives you the visibility needed to help you maintain effective cooling during normal operation, and provide sufficient cooling during failure and maintenance, without compromising energy efficiency.
The Diagram
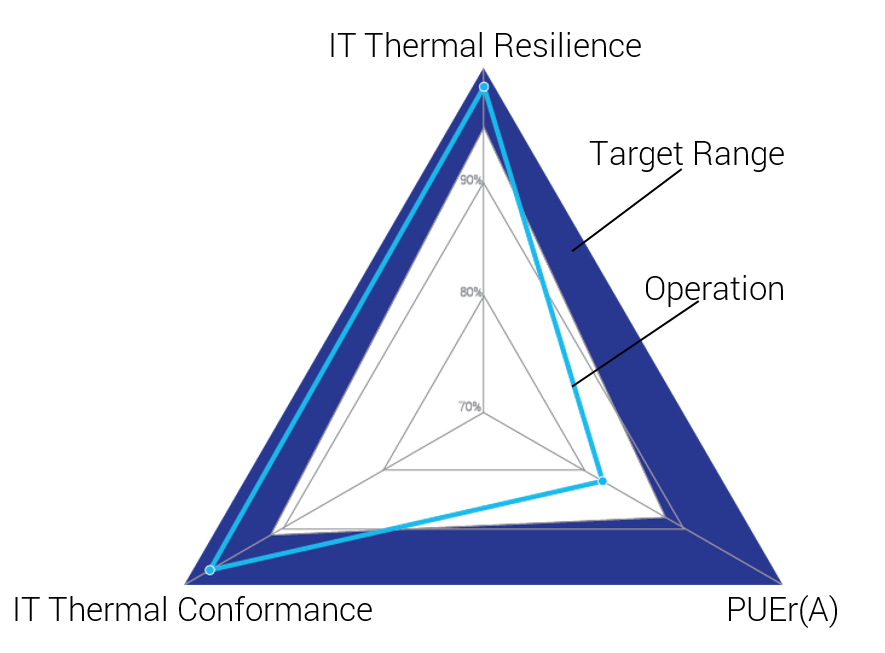
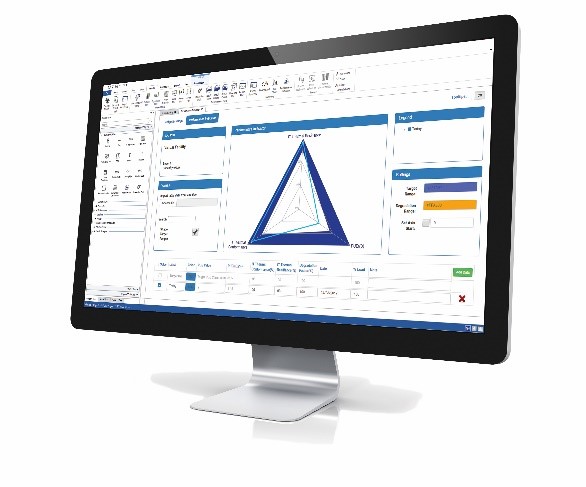
The PI’s spider diagram displays three unique and interconnected metrics:
- PUE ratio (PUEr) – comparing your actual PUE against your design intentions.
- IT Thermal Conformance – percentage of IT that operates at suitable inlet temperatures during normal operation.
- IT Thermal Resilience – percentage of IT that operates at suitable inlet temperatures during cooling failure and planned maintenance.
PI - What is it Good For?
1. VISUALIZE QUANTIFIED PERFORMANCE
You can quantify these metrics, and visualize how they interact with each other.
For example, pushing for energy efficiency improvements could be detrimental to thermal conformance and resilience. Or vice versa - you want your data center to be cool… but not too cool!
2. SET REALISTIC PERFORMANCE TARGETS
Target ranges for all the metrics should be based on the challenges faced by your data center, not some generic industry expectation for performance.
Consider your business needs (such as maximizing resilience), the type of facility (infrastructure), and the external environment (climate, season etc.).
For instance, an Hawaiian investment bank may have slightly different targets to a free-cooled social media site in Scandinavia!
3. EXPLORE TARGET VS. ACTUAL PERFORMANCE
You can compare how the facility actually operates (blue line) against the targets you have set, as well as track the facility’s performance over time, as and when changes occur (dotted orange line).
Your PI score can comprise as many triangles as you like!
4. COMPARE OPERATIONAL PLANS
You will then be ready to compare the relative performance of your operational plans – whether they’re fixes, improvement measures, or IT deployment plans.
Implementing such operational plans may call for you to reconsider realistic targets for your data center, and set an updated benchmark for performance.
Measurement and Simulation
What do you need to calculate your PI score? The Green Grid proposes four levels of assessment, and it’s easy to begin with basic on-site thermal measurements: you can calculate level 1 PI scores using only temperature sensors and a spreadsheet!
To achieve the full benefit of PI, you can introduce monitoring systems or thermal imaging for fast and comprehensive data collection, and include engineering simulation (using the Virtual Facility) to accurately predict future thermal behavior.
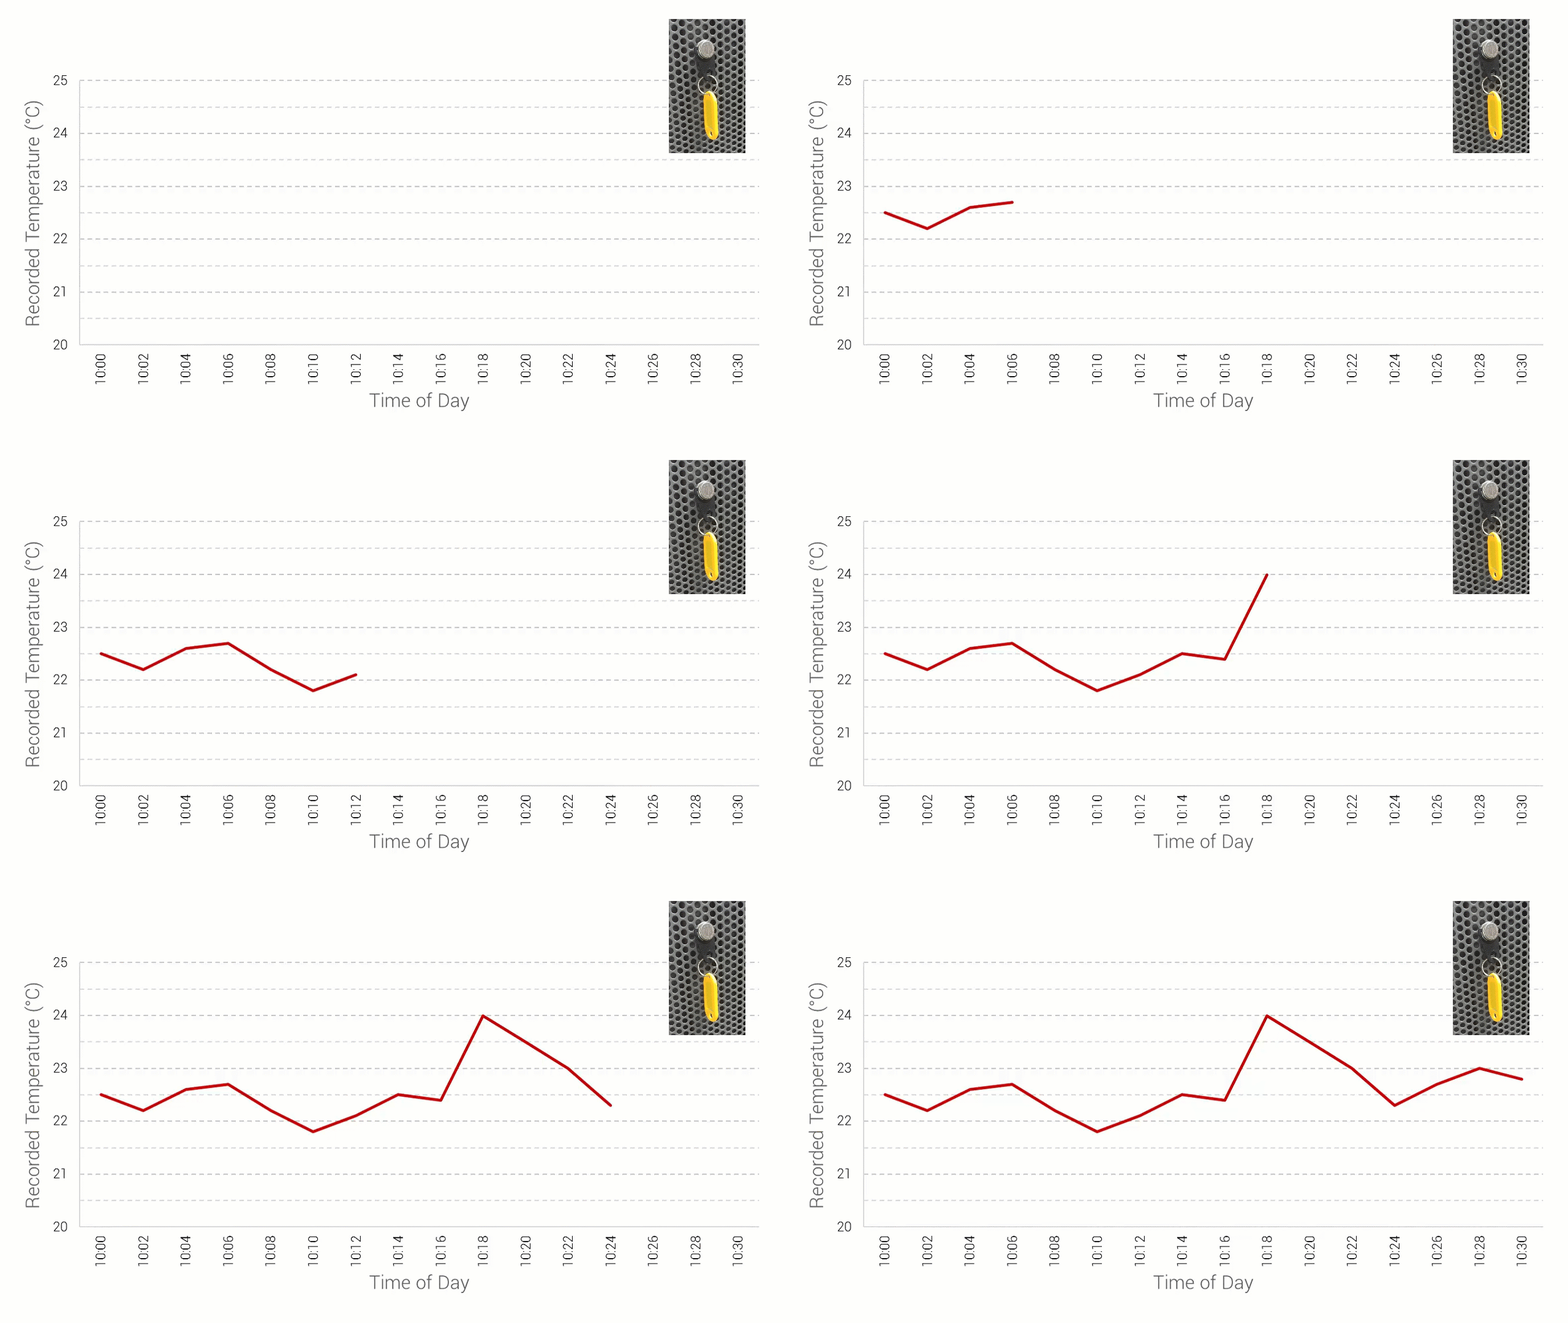
Sensors located on the fronts of racks monitor point temperatures over time.
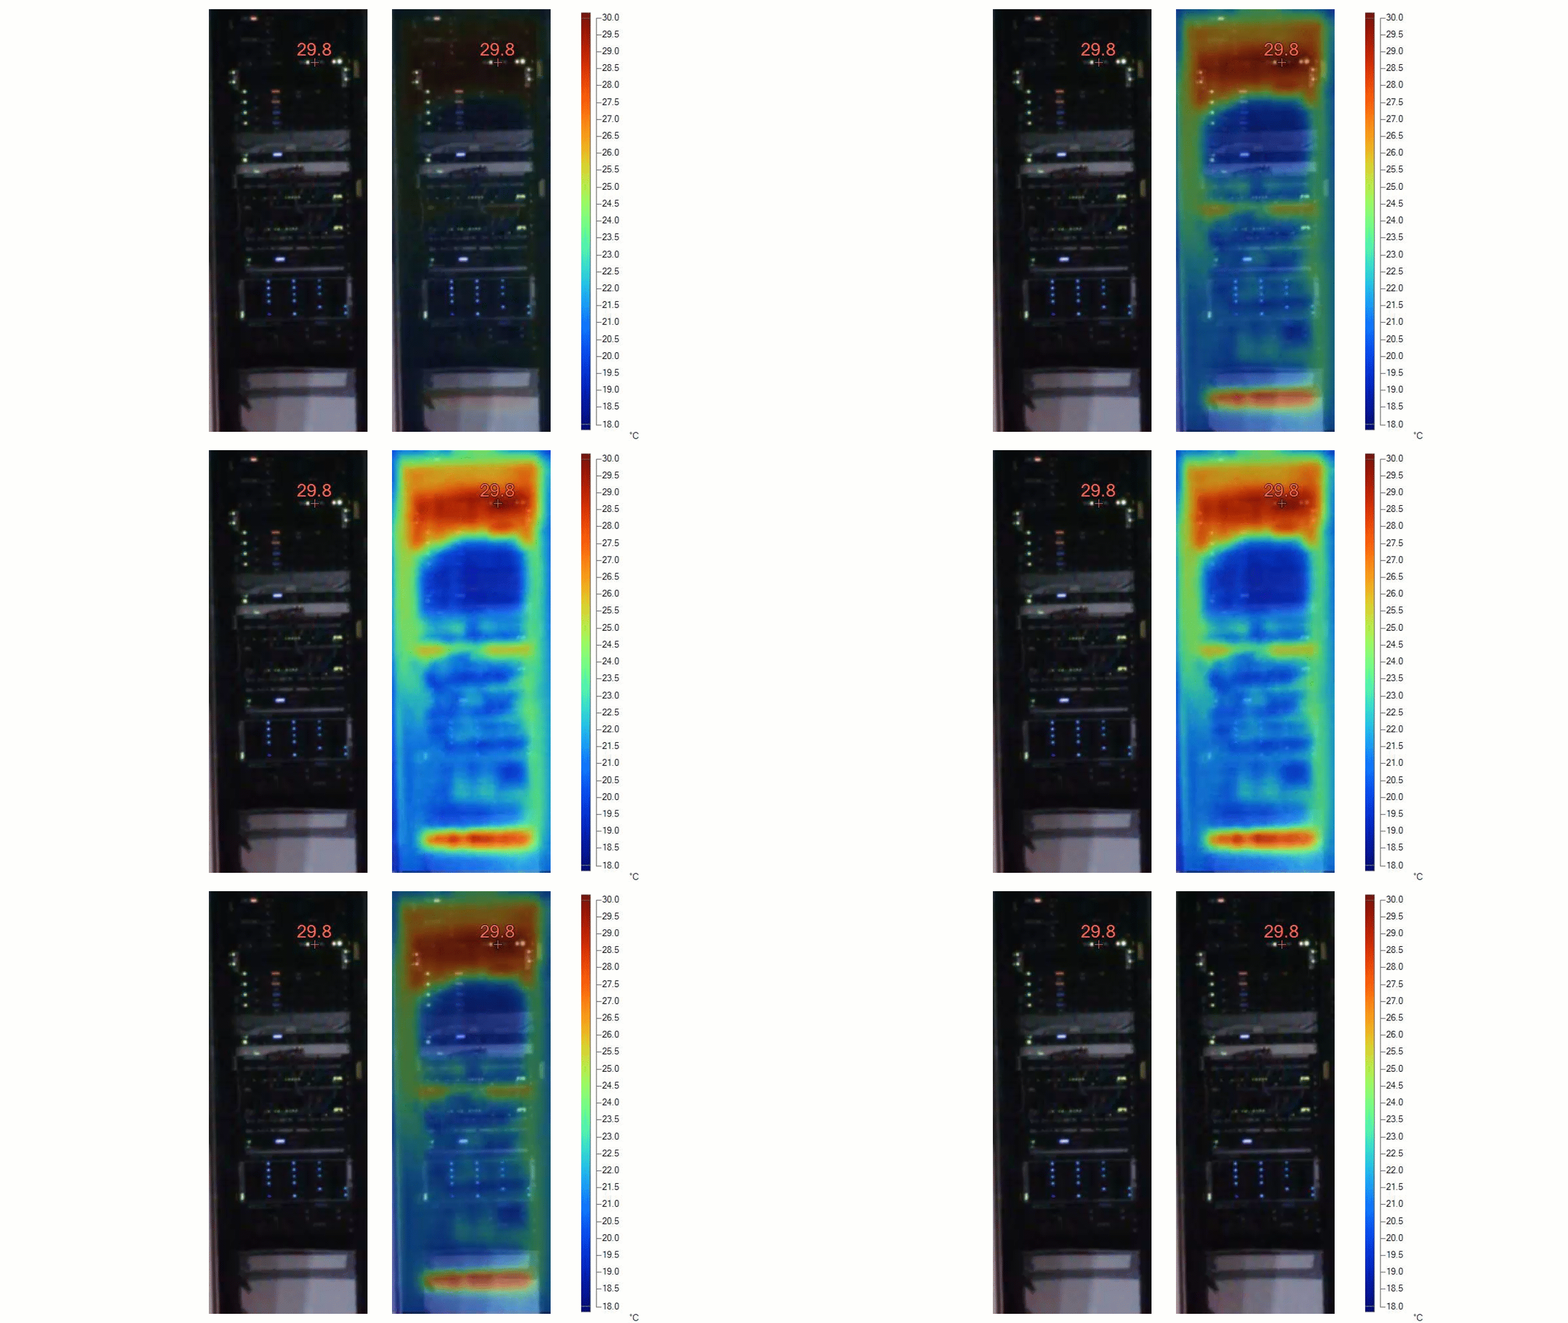
Thermal images give a fuller ‘snapshot in time’ view, without being limited to a single point.
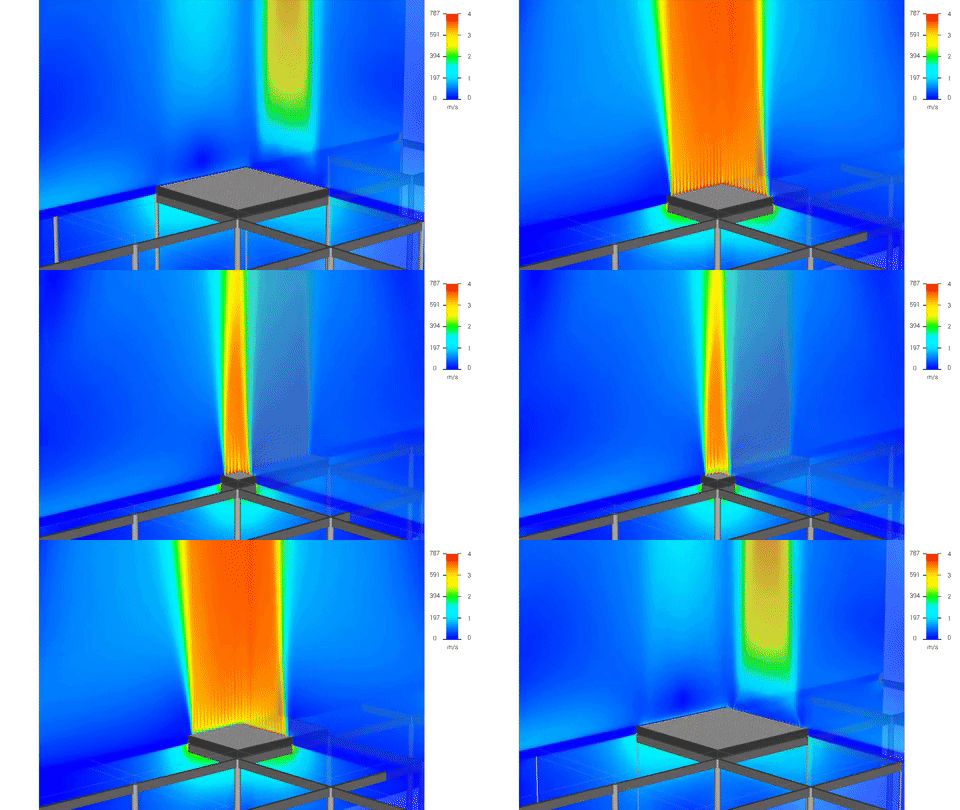
Simulations provide more than just temperature information. Here you can see how grille flow varies along the cross-section.
Measurement alone can be very effective in establishing the PI score and visualizing current performance. However, if you want to consider future states of the facility, you’ll need simulation.
By combining measurement tools and the Virtual Facility, you get a reliable, accurate, and calibrated model that allows you to make decisions with confidence. From here, for any case inspection, employ PI, investigate pitfalls in operation, and solve them in time for the next episode.
The Tool
Future Facilities’s 6SigmaRoom (and The Green Grid’s website) are home to a handy tool that makes generating PI plots very straightforward. It gives you the flexibility to customize the view, choose which data to display, and save your recorded data – making performance reporting easier than ever before.
Conclusion
To perform well in the face of continuous change, you need to maintain your productivity while managing your risk. That has long been easier said than done…. until now. The Green Grid’s Performance Indicator helps you achieve just that.
You can set target ranges, and assess where your data center performance lies in relation to your business needs and facility type.
Through measurements, simulation of the Virtual Facility, and the PI tool, you can now investigate and optimize your data center cooling performance the way you always wanted, but never knew how.
For instructions and a detailed example on how to collect the data, generate CFD simulations and calculate the metrics, see the Performance Indicator white paper.
The content from this blog originally appeared in the Future Facilities blog on June 30, 2017.
